Carrier Reports Strong 2023 Results and Announces 2024 Outlook

Fourth Quarter 2023 Highlights
- Sales of $5.1B
- Operating margin expansion of 340 basis points and adjusted operating margin expansion of 80 basis points
- GAAP EPS of $0.49, up 53% vs. 2022 and adjusted EPS of $0.53, up 33% vs. 2022
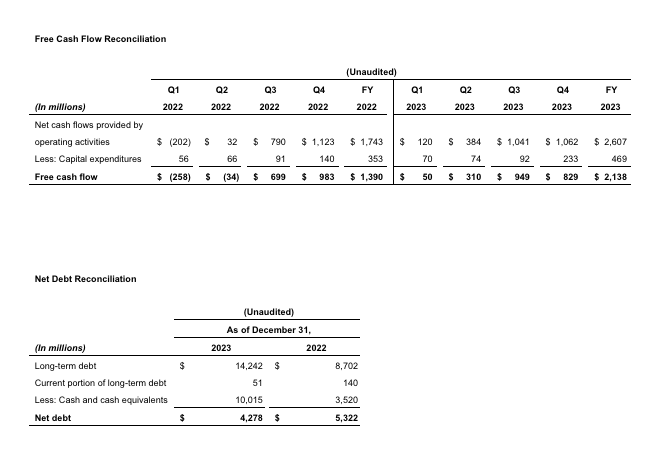
- Net cash flow from operating activities of $1.1B and free cash flow of $829M
Full Year 2023 Highlights
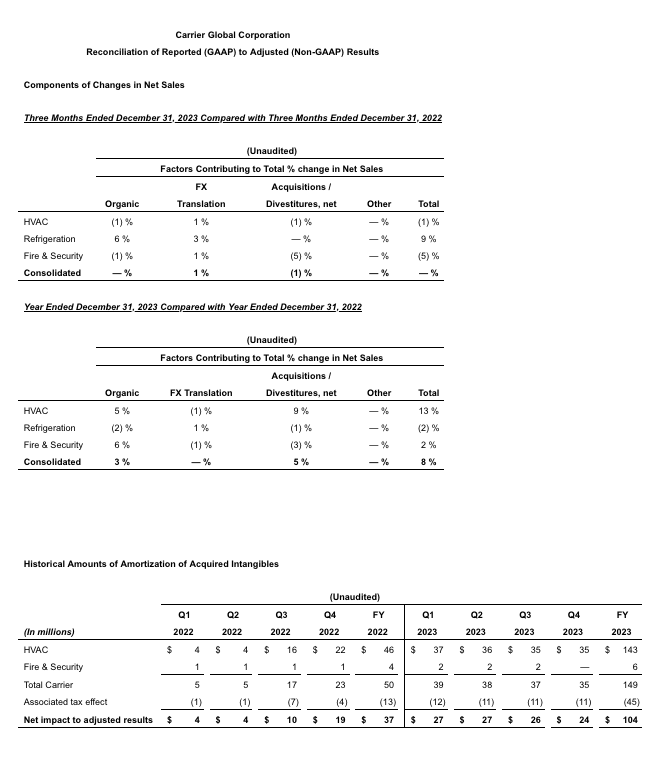
- Sales of $22.1B, up 8% compared to 2022 including 3% organic growth
- Gross margins up 210 basis points compared to 2022
- GAAP EPS of $1.58 and adjusted EPS of $2.73
- Net cash flow from operating activities of $2.6B and free cash flow of $2.1B, up 49% and 53%, respectively
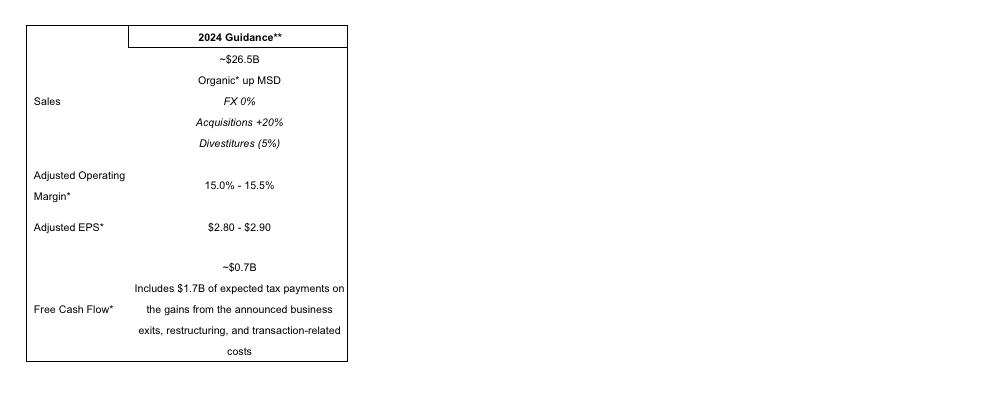
Outlook for 2024
- Global Access Solutions and Commercial Refrigeration included through June 30, 2024
- Viessmann Climate Solutions sales expected to grow mid-single-digits
- Assumes ~$4.5B net proceeds from business exits are used for debt reduction
- Sales of ~$26.5B with mid-single-digit organic* growth
- Adjusted operating margin* of 15.0% - 15.5%, up > 50 basis points compared to 2023
- Adjusted EPS* of $2.80 - $2.90
- Free cash flow* of ~$0.7B (includes $1.7B of expected tax payments on the gains from the announced business exits, restructuring, and transaction-related costs): up ~10% excluding these expected items
PALM BEACH GARDENS, Fla., February 6, 2024 /PRNewswire/ - Carrier Global Corporation (NYSE: CARR), global leader in intelligent climate and energy solutions, today reported strong financial results for the fourth quarter and full year of 2023. The Company projects continued solid organic growth in 2024 supported by a projected fourth consecutive year of double-digit aftermarket growth, innovation, and significant secular tailwinds.
“Our fourth quarter results continue to show Carrier's ability to perform while transforming with strong operating profit growth and EPS up over 30% compared to the prior year. For full-year 2023, we grew gross margins 210 basis points on 3% organic sales growth with both operating and free cash flow up about 50% compared to the prior year,” said Carrier Chairman & CEO David Gitlin. “In addition to delivering results ahead of our projections for the year, we completed our game-changing combination with Viessmann Climate Solutions in January and reached definitive agreements to sell both our Global Access Solutions and Commercial Refrigeration businesses for close to $6B combined. Looking forward to 2024, our solid backlog levels and sustainability leadership position Carrier for another year of strong financial performance.”
Fourth Quarter 2023 Results
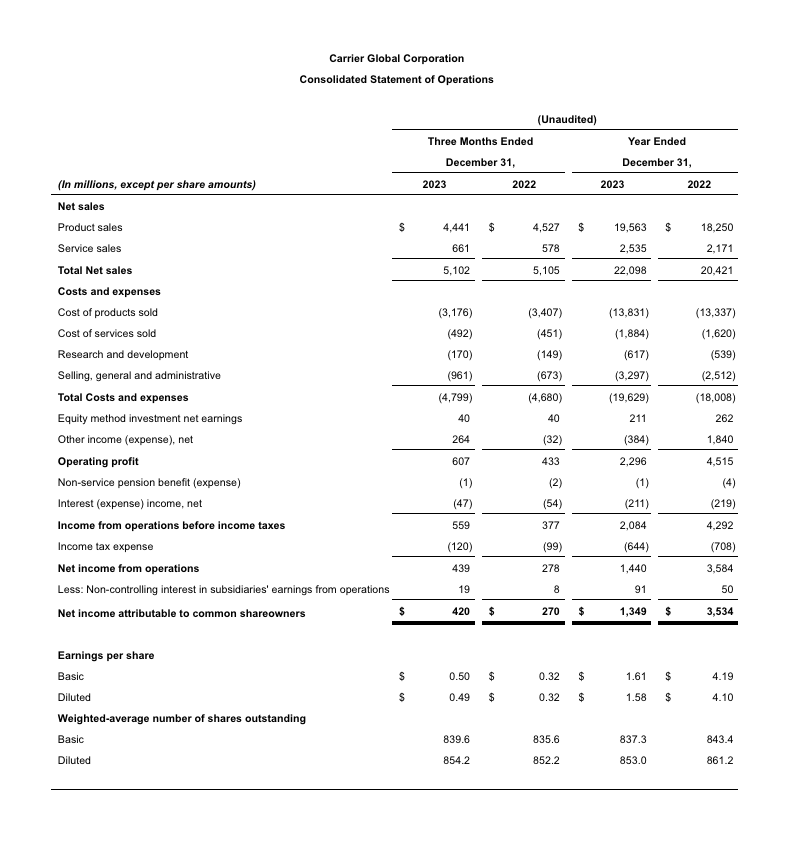
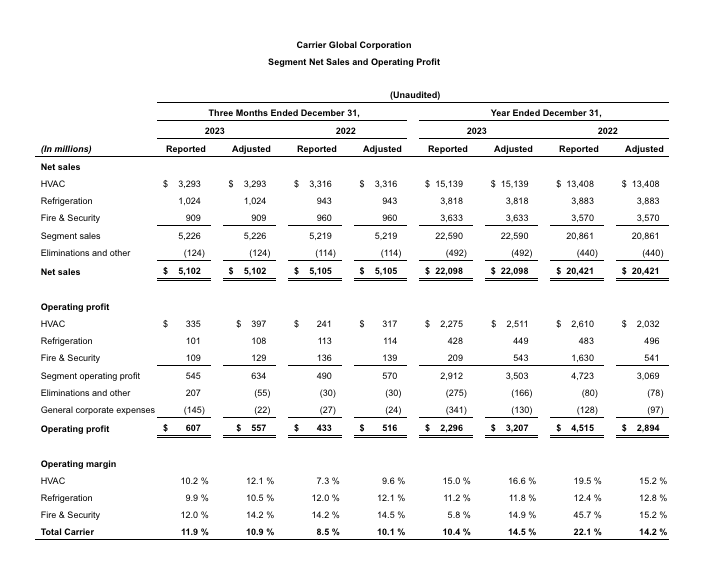
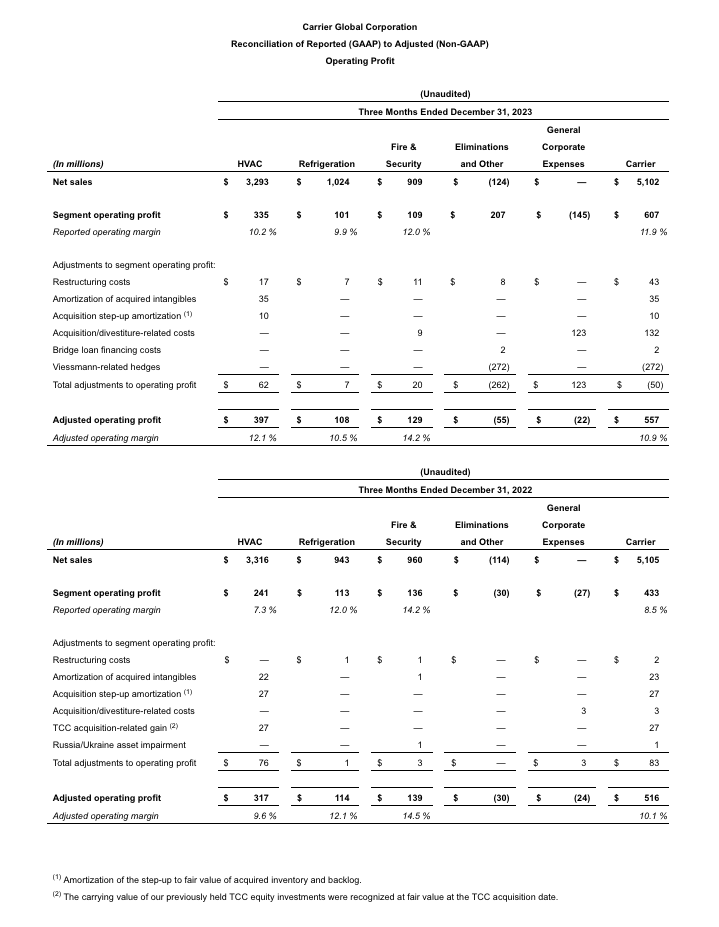
Carrier's fourth quarter sales of $5.1B were flat compared to the prior year including flat organic sales growth, a 1% tailwind from currency translation and a 1% net negative impact from acquisitions and divestitures. Sales in the HVAC segment were down 1% organically. North America Residential & Light Commercial HVAC sales declined high single digits due to weaker than expected residential sales as distributors reduced inventory levels. This was offset by high single digit growth in Commercial HVAC globally. The Refrigeration segment returned to growth this quarter, with organic sales up 6% driven by growth in Transport Refrigeration. Fire and Security organic sales were down 1% driven by Global Access Solutions and Residential Fire partially offset by growth in Industrial Fire.
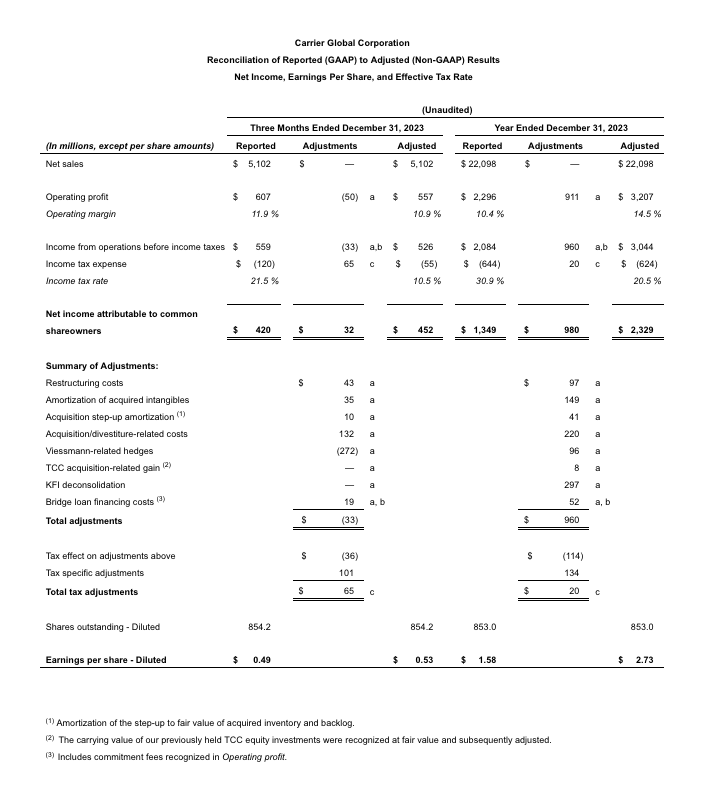
GAAP operating profit in the quarter of $607M was up 40% from the fourth quarter of 2022. Adjusted operating profit of $557M was up 8%.
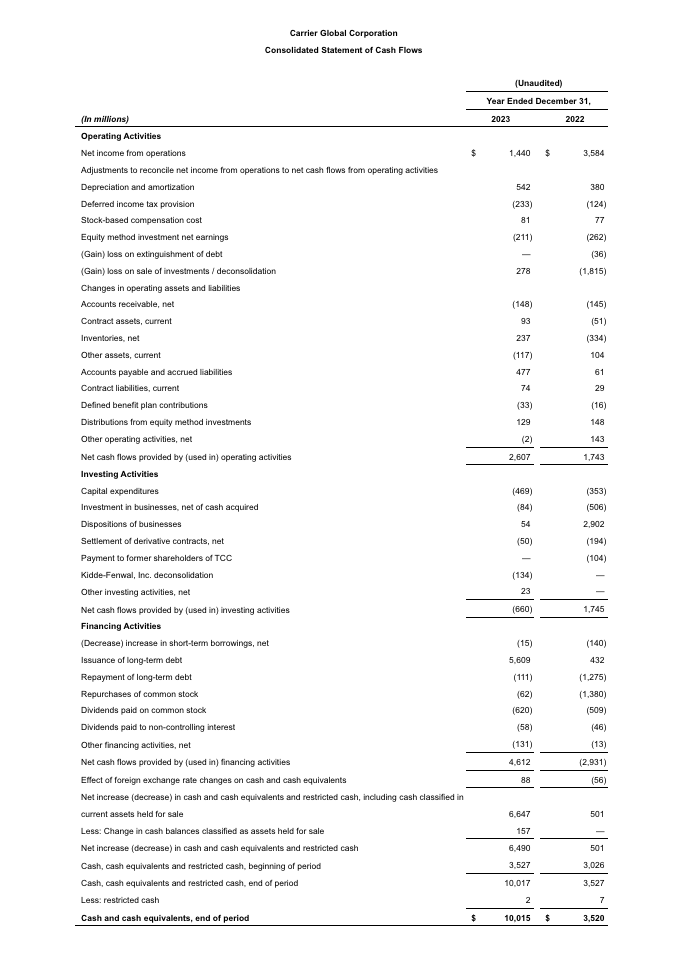
Net income and adjusted net income were $420M and $452M, respectively. GAAP EPS of $0.49 and adjusted EPS of $0.53 benefitted from operating margin expansion and lower effective tax rates. Net cash flows provided by operating activities for the quarter were approximately $1.1B and capital expenditures were $233M, resulting in free cash flow of $829M.
Full-Year 2023 Results
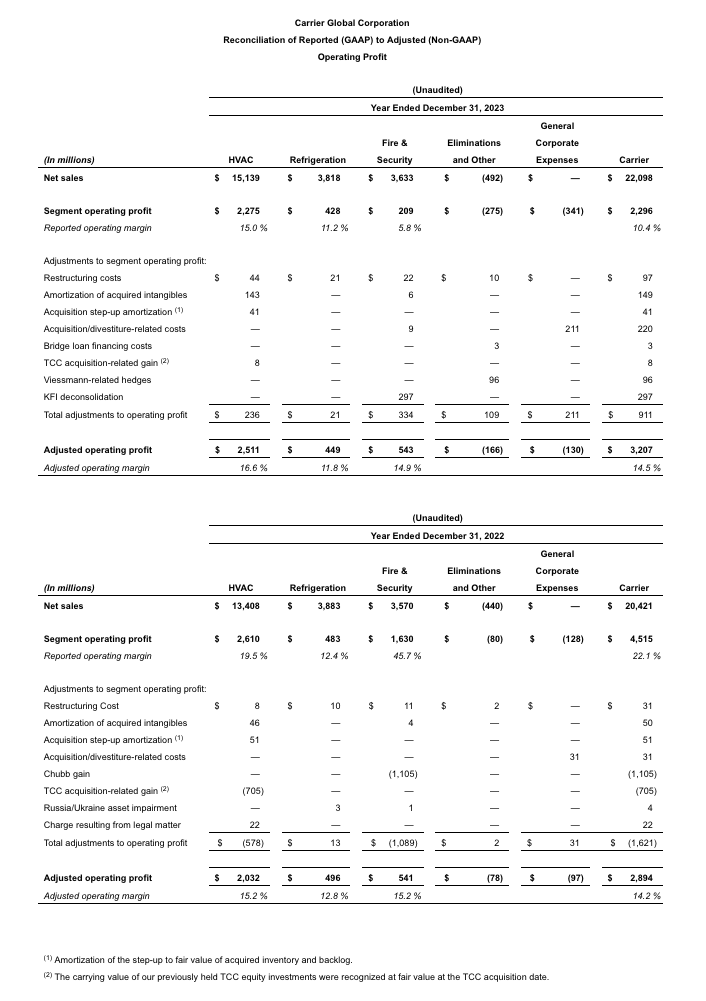
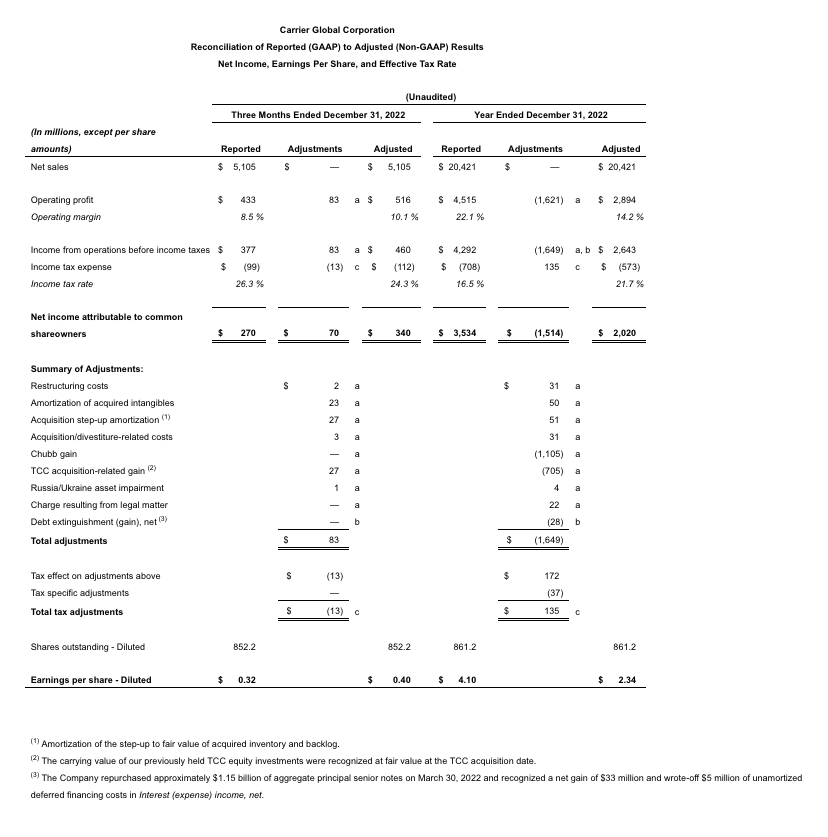
Carrier's 2023 sales of $22.1B increased 8% compared to the prior year including organic sales growth of 3% and a 5% impact from acquisitions and divestitures. Gross margins increased 210 basis points compared to the prior year. GAAP operating profit of $2.3B decreased 49% due to prior year gains on the sale of Chubb and the acquisition of Toshiba Carrier, while adjusted operating profit increased 11% to $3.2B. Operating margin decreased due to the prior year impact of the Chubb and Toshiba Carrier-related gains. Adjusted operating margin increased despite the impact from the consolidation of Toshiba Carrier. Strong price realization more than offset continued inflation and productivity savings more than offset strategic incremental investments.
GAAP EPS was $1.58 and adjusted EPS was $2.73. Net income was $1.3B, and adjusted net income was $2.3B. Net cash flows provided by operating activities were $2.6B and capital expenditures were $469M, resulting in free cash flow of $2.1B. During the quarter the company issued $5.6B of debt related to the acquisition of Viessmann Climate Solutions.
Full-Year 2023 Guidance
Carrier is announcing the following outlook for 2024:
|
*Note: When the company provides expectations for organic sales, adjusted operating profit, adjusted operating margin, adjusted EPS and free cash flow on a forward-looking basis, a reconciliation of the differences between the non-GAAP expectations and the corresponding GAAP measures generally is not available without unreasonable effort. See “Use and Definitions of Non-GAAP Financial Measures” below for additional information. |
|
**As of February 6, 2024 |
Conference Call
Carrier will host a webcast of its earnings conference call today, Tuesday, February 6, 2024, at 7:30 a.m. ET. To access the webcast, visit the Events & Presentations section of the Carrier Investor Relations site at ir.carrier.com/news-and-events/events-and-presentations or to listen to the earnings call by phone, participants must pre-register at Carrier Earnings Call Registration. All registrants will receive dial-in information and a PIN allowing access to the live call.
Cautionary Statement
This communication contains statements which, to the extent they are not statements of historical or present fact, constitute "forward-looking statements" under the securities laws. These forward-looking statements are intended to provide management's current expectations or plans for Carrier's future operating and financial performance, based on assumptions currently believed to be valid. Forward-looking statements can be identified by the use of words such as "believe," "expect," "expectations," "plans," "strategy," "prospects," "estimate," "project," "target," "anticipate," "will," "should," "see," "guidance," "outlook," "confident," "scenario" and other words of similar meaning in connection with a discussion of future operating or financial performance. Forward-looking statements may include, among other things, statements relating to future sales, earnings, cash flow, results of operations, uses of cash, share repurchases, tax rates and other measures of financial performance or potential future plans, strategies or transactions of Carrier, Carrier's plans with respect to its indebtedness and other statements that are not historical facts. All forward-looking statements involve risks, uncertainties and other factors that may cause actual results to differ materially from those expressed or implied in the forward-looking statements. For additional information on identifying factors that may cause actual results to vary materially from those stated in forward-looking statements, see Carrier's reports on Forms 10-K, 10-Q and 8-K filed with or furnished to the U.S. Securities and Exchange Commission from time to time. Any forward-looking statement speaks only as of the date on which it is made, and Carrier assumes no obligation to update or revise such statement, whether as a result of new information, future events or otherwise, except as required by applicable law.
About Carrier
Carrier Global Corporation, global leader in intelligent climate and energy solutions, is committed to creating solutions that matter for people and our planet for generations to come. From the beginning, we've led in inventing new technologies and entirely new industries. Today, we continue to lead because we have a world-class, diverse workforce that puts the customer at the center of everything we do. For more information, visit corporate.carrier.com or follow Carrier on social media at @Carrier.
CARR-IR
| Contact | Investor Relations |
| Sam Pearlstein | |
| 561-365-2251 | |
| [email protected] | |
| Media Inquiries | |
| Ashley Barrie | |
| 561-365-1260 | |
| [email protected] |
SELECTED FINANCIAL DATA, NON-GAAP MEASURES AND DEFINITIONS
Following are tables that present selected financial data of Carrier Global Corporation. Also included are reconciliations of non-GAAP measures to their most comparable GAAP measures.
Use and Definitions of Non-GAAP Financial Measures
Carrier Global Corporation ("we" or "our") reports its financial results in accordance with accounting principles generally accepted in the United States ("GAAP"). We supplement the reporting of our financial information determined under GAAP with certain non-GAAP financial information. The non-GAAP information presented provides investors with additional useful information, but should not be considered in isolation or as substitutes for the related GAAP measures. Moreover, other companies may define non-GAAP measures differently, which limits the usefulness of these measures for comparisons with such other companies. We encourage investors to review our financial statements and publicly filed reports in their entirety and not to rely on any single financial measure. A reconciliation of the non-GAAP measures to the corresponding amounts prepared in accordance with GAAP appears in the tables in this Appendix. The tables provide additional information as to the items and amounts that have been excluded from the adjusted measures.
Organic sales, adjusted operating profit, adjusted operating margin, incremental margins / earnings conversion, earnings before interest, taxes and depreciation and amortization ("EBITDA"), adjusted EBITDA, adjusted net income, adjusted earnings per share ("EPS"), adjusted interest expense, net, adjusted effective tax rate and net debt are non-GAAP financial measures.
Organic sales represents consolidated net sales (a GAAP measure), excluding the impact of foreign currency translation, acquisitions and divestitures completed in the preceding twelve months and other significant items of a nonoperational nature (hereinafter referred to as "other significant items"). Adjusted operating profit represents operating profit (a GAAP measure), excluding restructuring costs, amortization of acquired intangibles and other significant items. Adjusted operating margin represents adjusted operating profit as a percentage of net sales (a GAAP measure). Incremental margins / earnings conversion represents the year-over-year change in adjusted operating profit divided by the year-over-year change in net sales. EBITDA represents net income attributable to common shareholders (a GAAP measure), adjusted for interest income and expense, income tax expense, and depreciation and amortization. Adjusted EBITDA represents EBITDA, as calculated above, excluding non-service pension benefit, non-controlling interest in subsidiaries’ earnings from operations, restructuring costs and other significant items. Adjusted net income represents net income attributable to common shareowners (a GAAP measure), excluding restructuring costs, amortization of acquired intangibles and other significant items. Adjusted EPS represents diluted earnings per share (a GAAP measure), excluding restructuring costs, amortization of acquired intangibles and other significant items. Adjusted interest expense, net represents interest expense (a GAAP measure) and interest income (a GAAP measure), net excluding other significant items. The adjusted effective tax rate represents the effective tax rate (a GAAP measure), excluding restructuring costs, amortization of acquired intangibles and other significant items. Net debt represents long-term debt (a GAAP measure) less cash and cash equivalents (a GAAP measure). For the business segments, when applicable, adjustments of operating profit and operating margins represent operating profit, excluding restructuring, amortization of acquired intangibles and other significant items.
Free cash flow is a non-GAAP financial measure that represents net cash flows provided by operating activities (a GAAP measure) less capital expenditures. Management believes free cash flow is a useful measure of liquidity and an additional basis for assessing our ability to fund its activities, including the financing of acquisitions, debt service, repurchases of our common stock and distribution of earnings to shareowners.
Orders are contractual commitments with customers to provide specified goods or services for an agreed upon price and may not be subject to penalty if cancelled.
When we provide our expectations for organic sales, adjusted operating profit, adjusted operating margin, adjusted interest expense, net, adjusted effective tax rate, incremental margins/earnings conversion, adjusted EPS and free cash flow on a forward-looking basis, a reconciliation of the differences between the non-GAAP expectations and the corresponding GAAP measures (expected net sales, operating profit, operating margin, interest expense, effective tax rate, incremental operating margin, diluted EPS and net cash flows provided by operating activities) generally is not available without unreasonable effort due to potentially high variability, complexity and low visibility as to the items that would be excluded from the GAAP measure in the relevant future period, such as unusual gains and losses, the ultimate outcome of pending litigation, fluctuations in foreign currency exchange rates, the impact and timing of potential acquisitions and divestitures, future restructuring costs, and other structural changes or their probable significance. The variability of the excluded items may have a significant, and potentially unpredictable, impact on our future GAAP results.